Covid Shopping Spree
How Americans’ Pandemic Shopping Behavior Changed Sales Figures
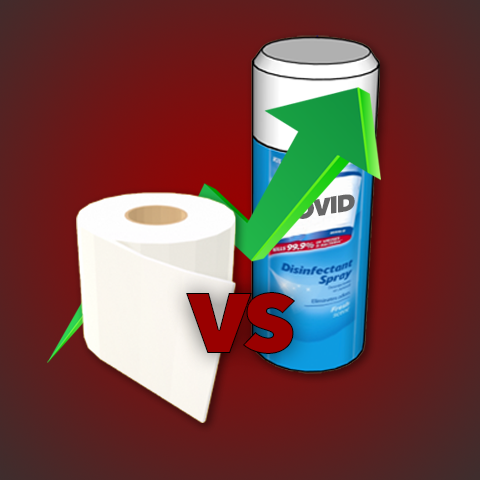
Photo Source: Christopher Corneschi
Crowded grocery stores and empty shelves became the new normal at the start of the pandemic as people fill their pantries with items they thought would protect them.
While toilet paper and hand sanitizers may seem like the most popular, the actual top three most purchased items in the U.S. in mid-March compared to a year ago may surprise you.
Inspired by a data story published by Time magazine, JOVRNALISM created an Instagram AR filter that quizzes you on the year-over-year change in sales for eight common goods.
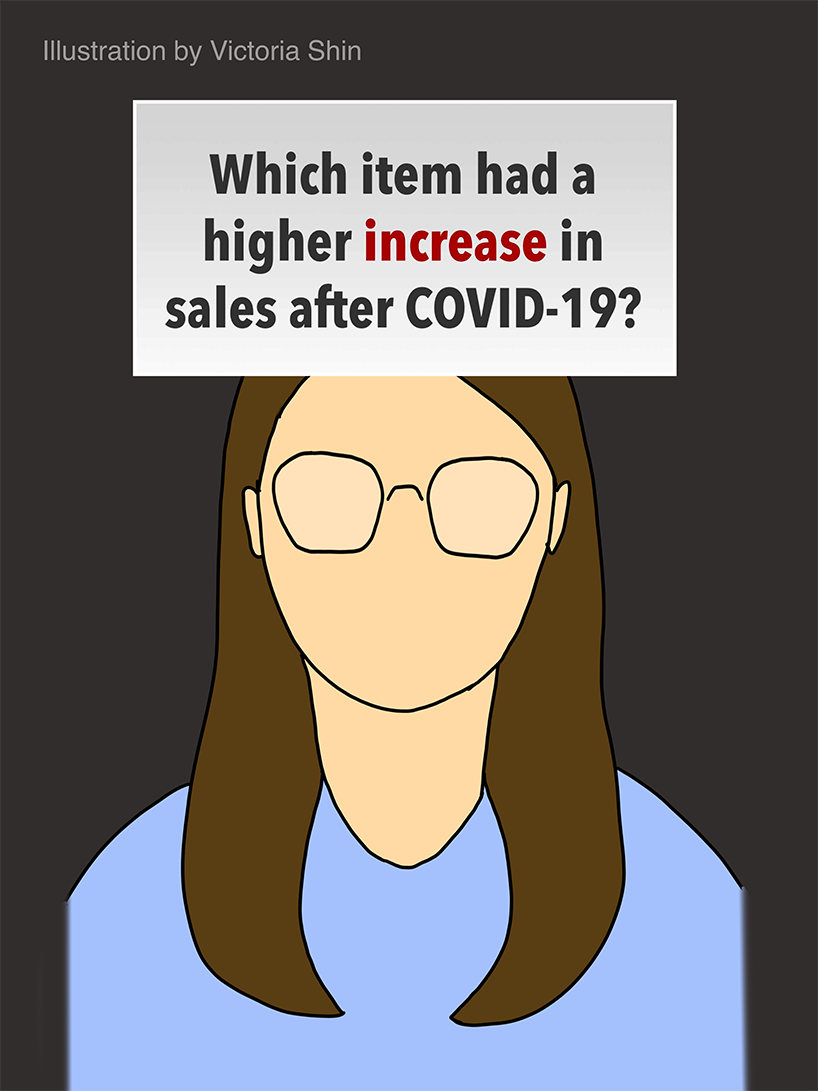
"We used 3D models and proportional scaling animation to make the data more interactive," said Victoria Shin, one of the four students working on this project. "We decided to make it in a quiz format so users can use it more interactively. We also decided to display the models on the back camera, so it has more AR touch to it."
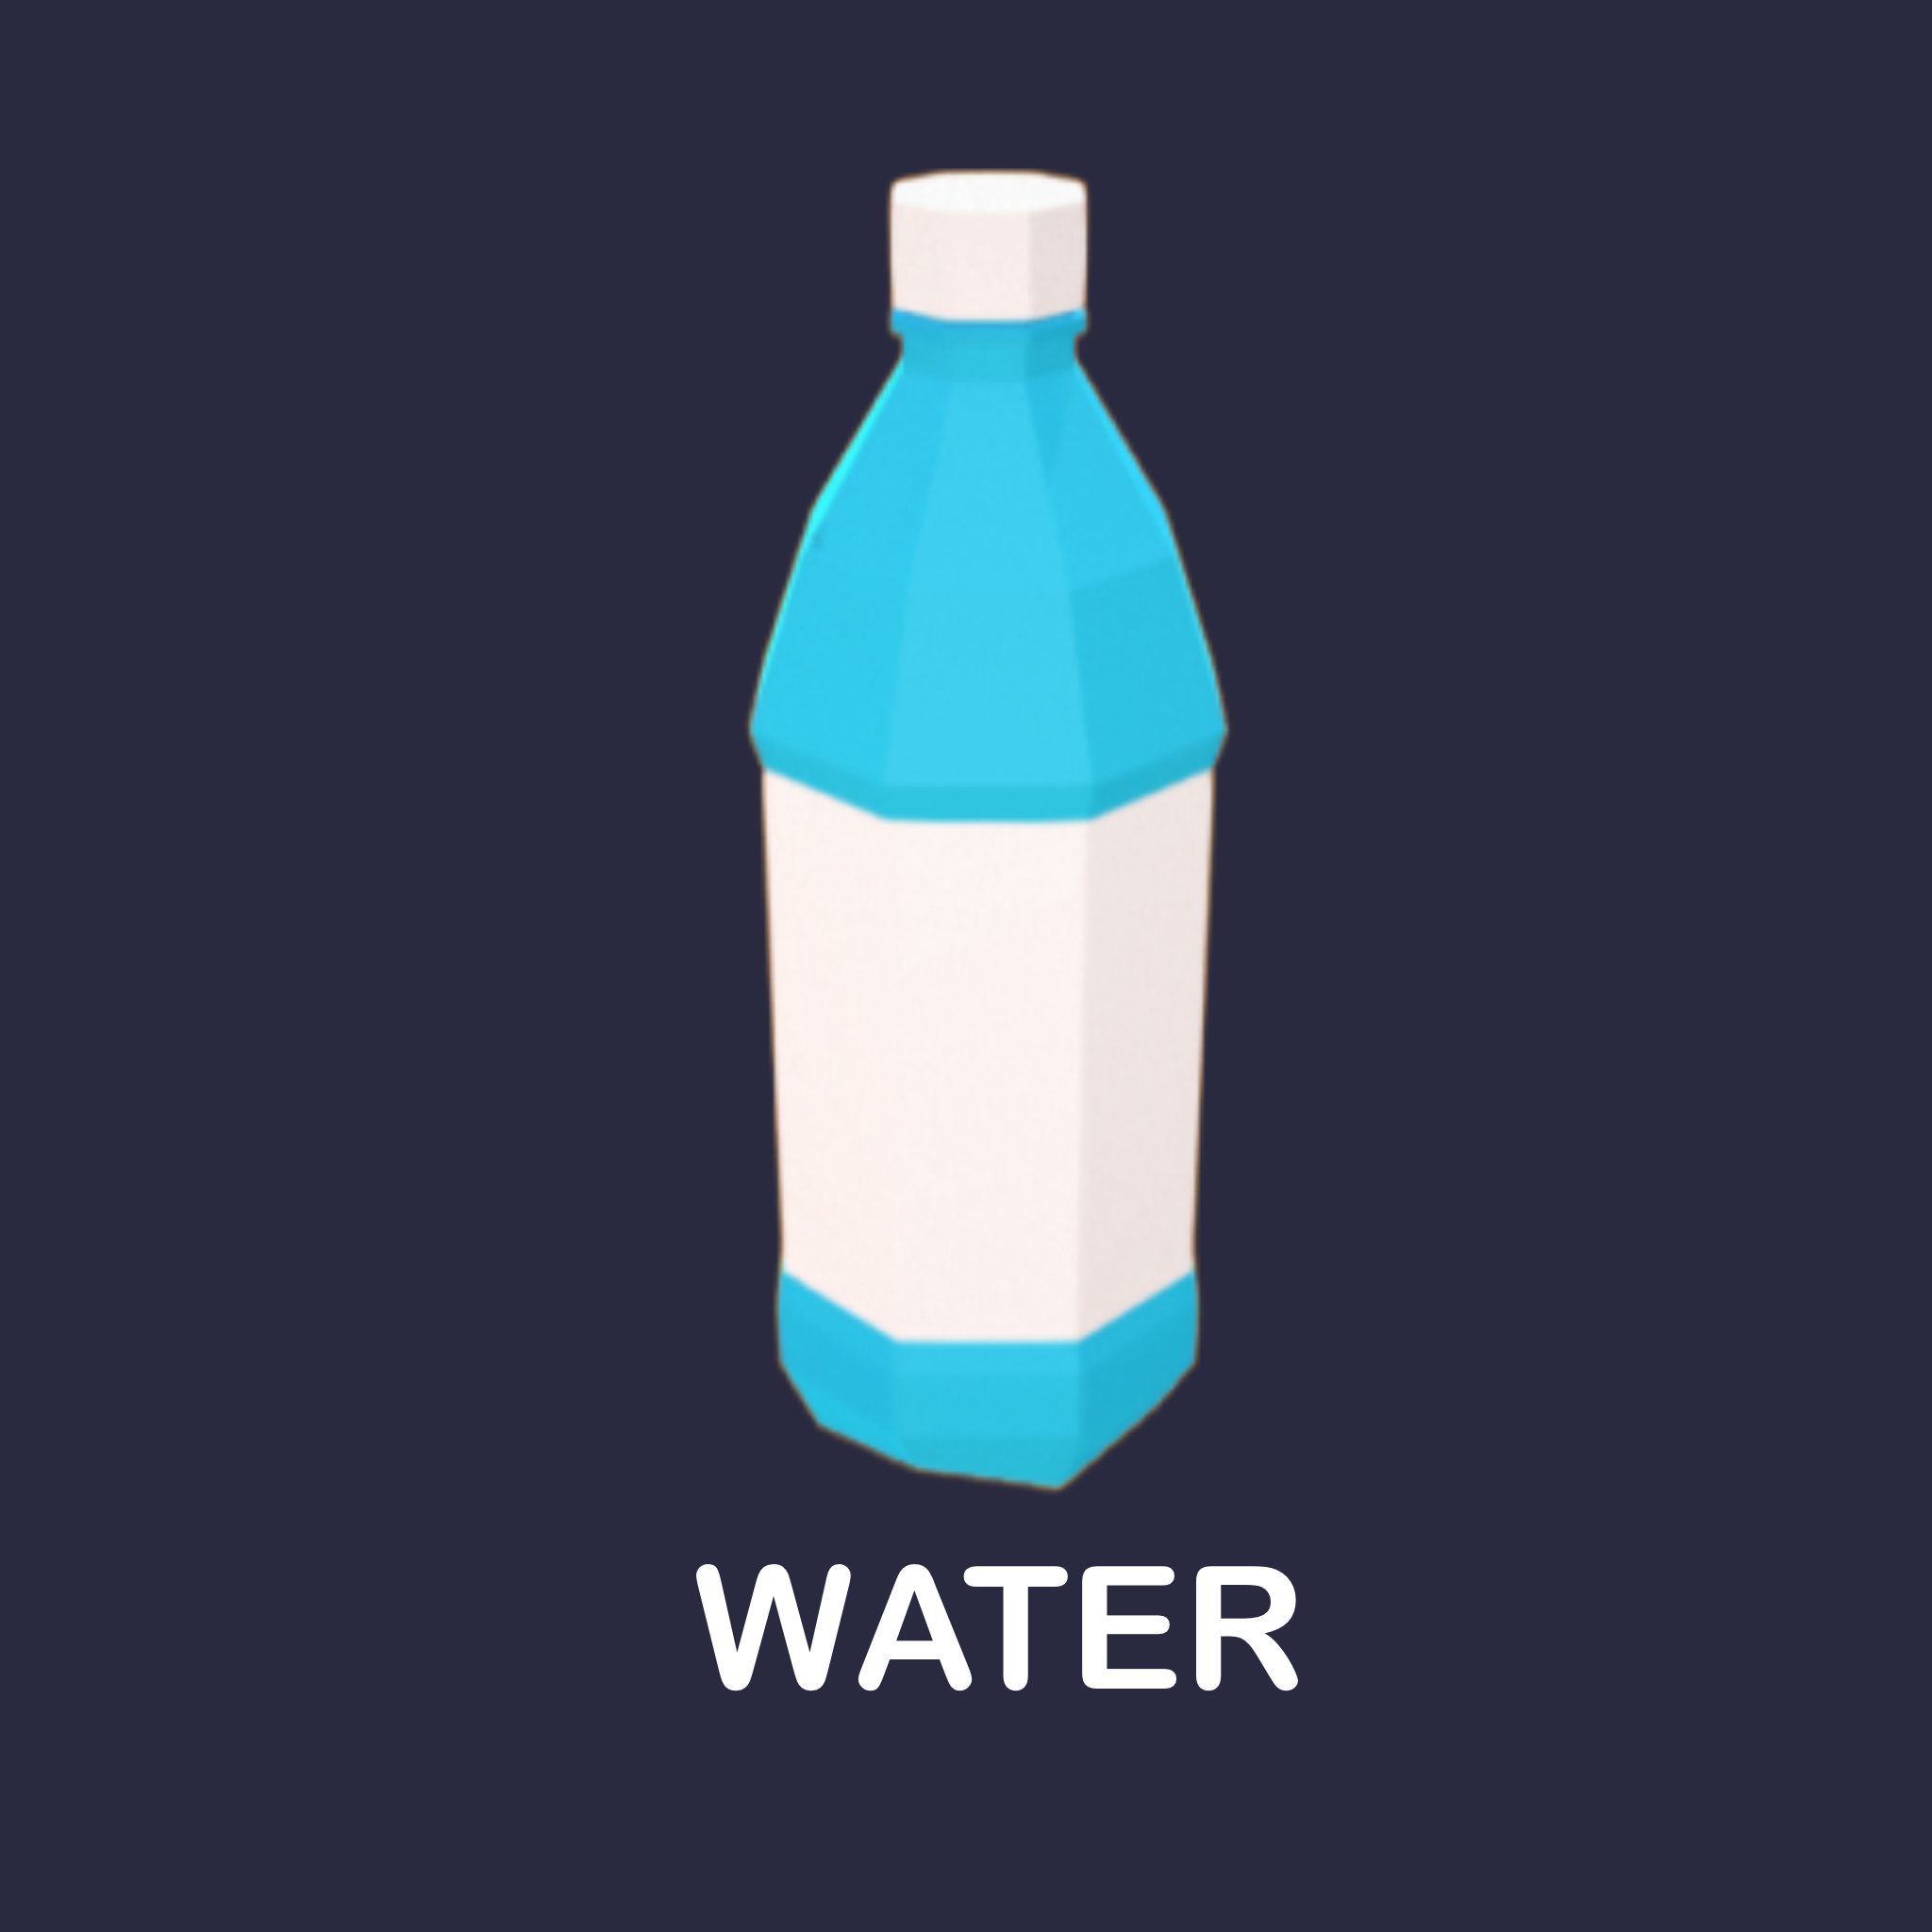
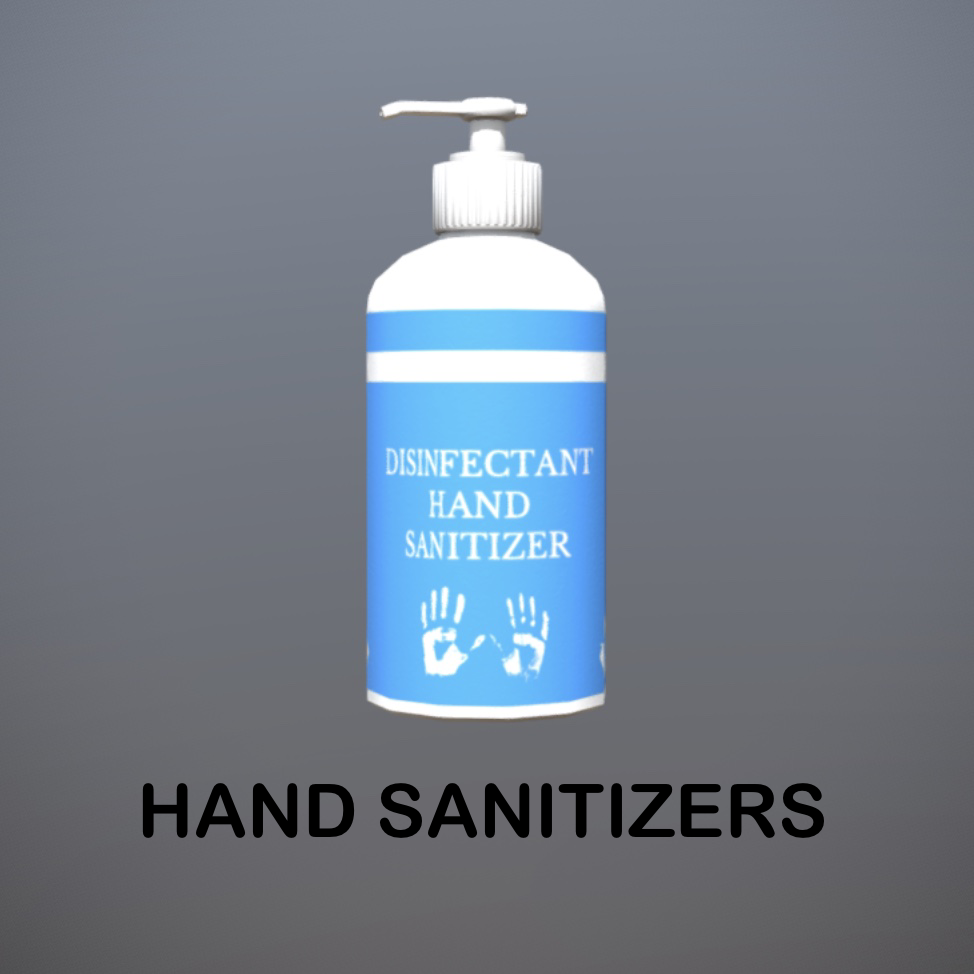
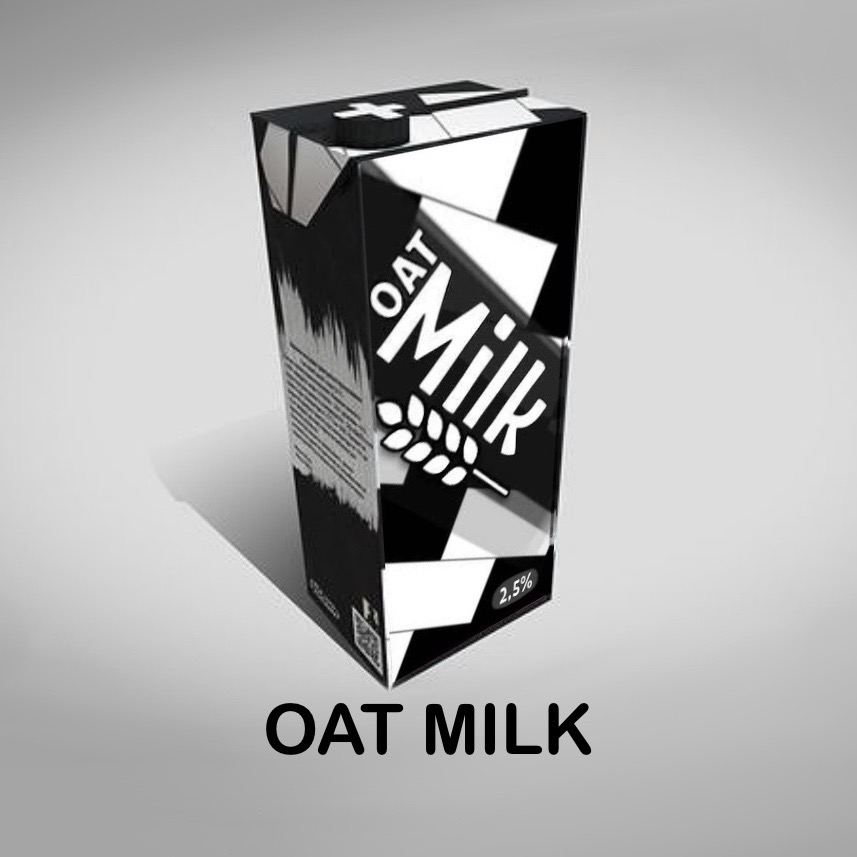
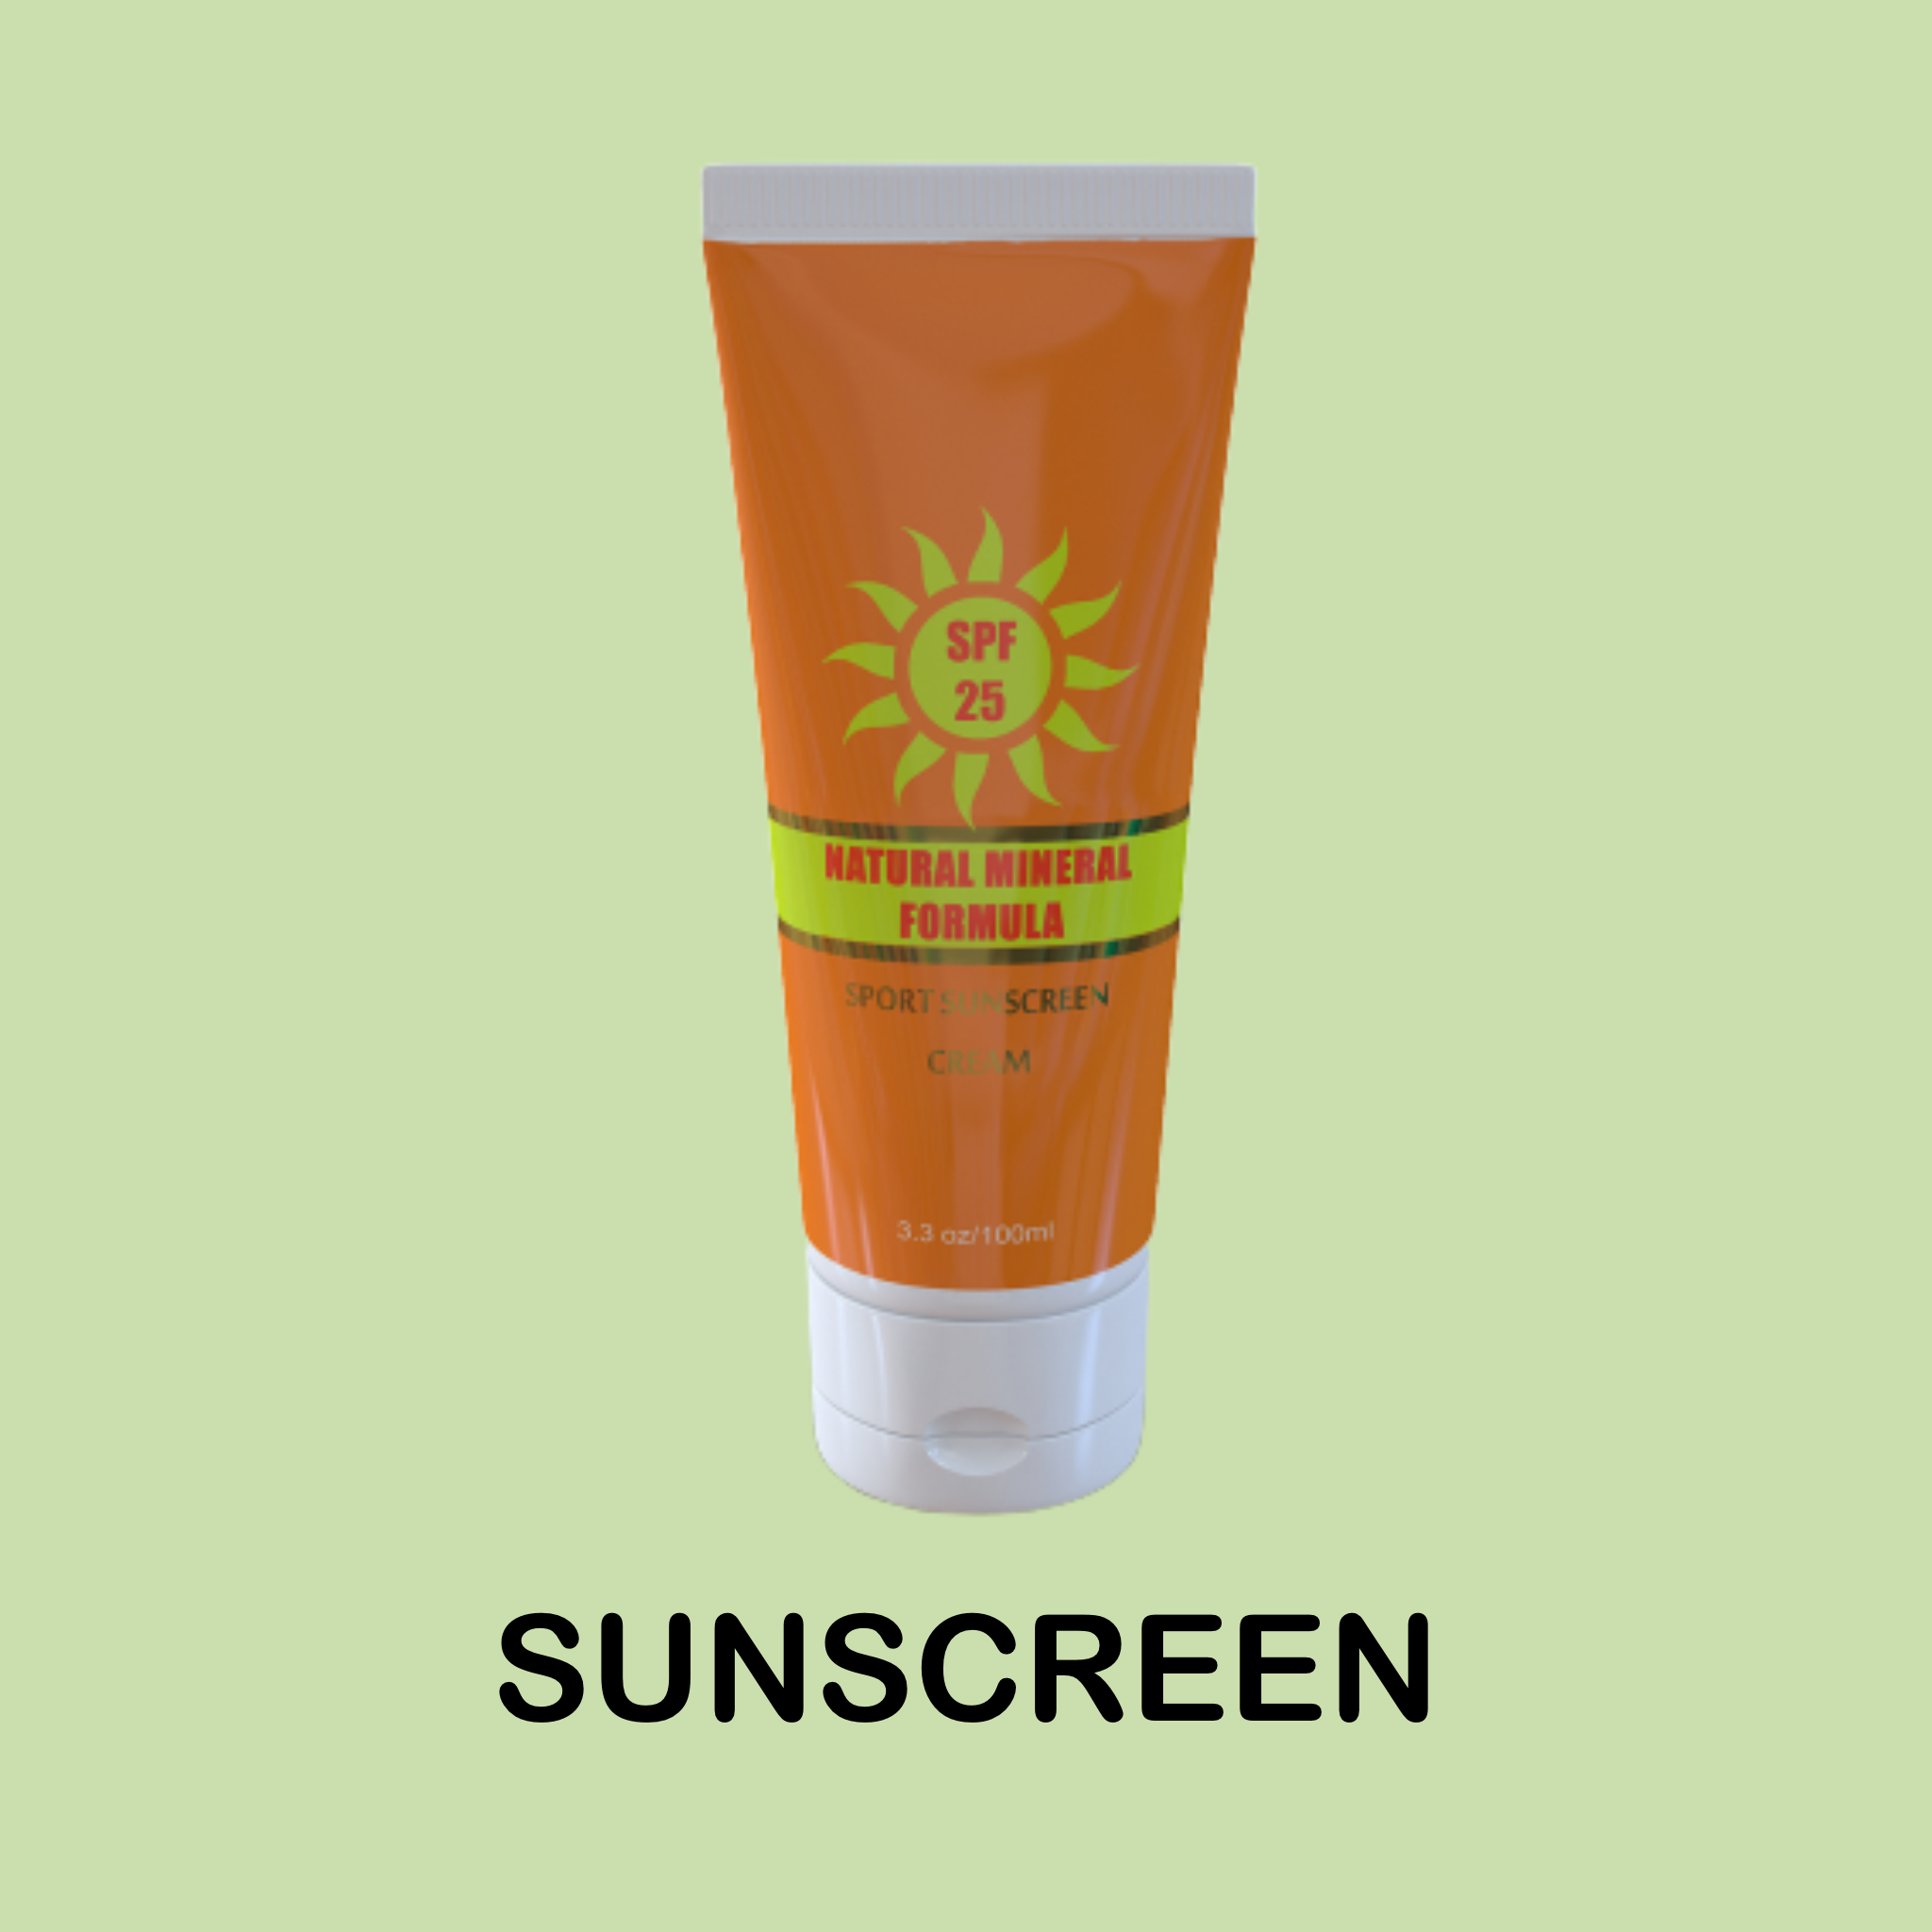
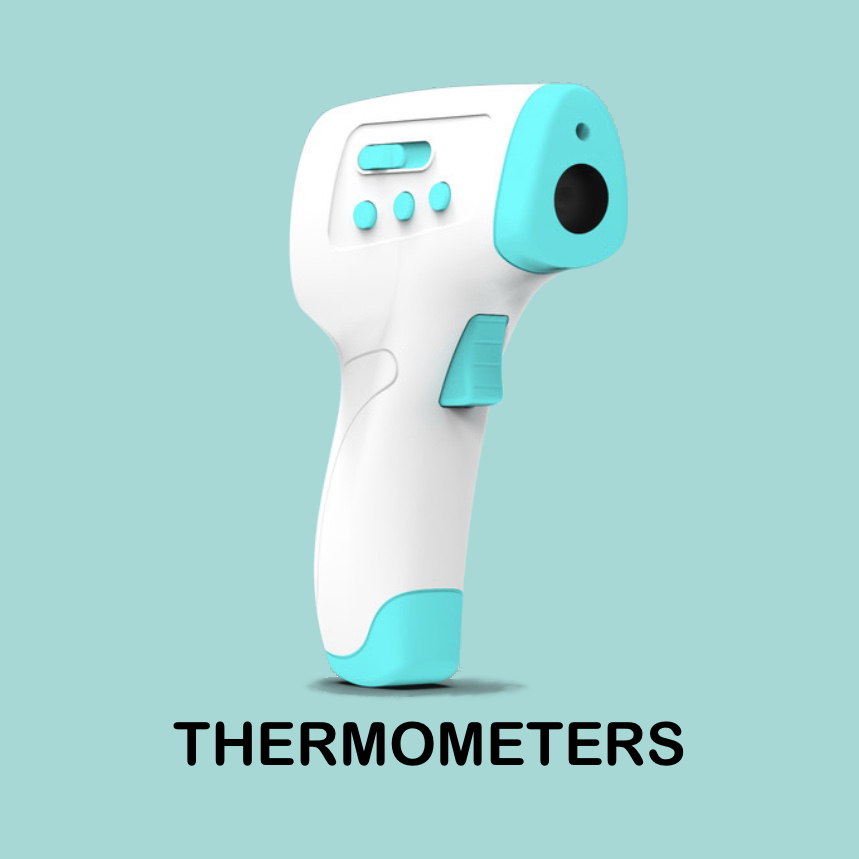
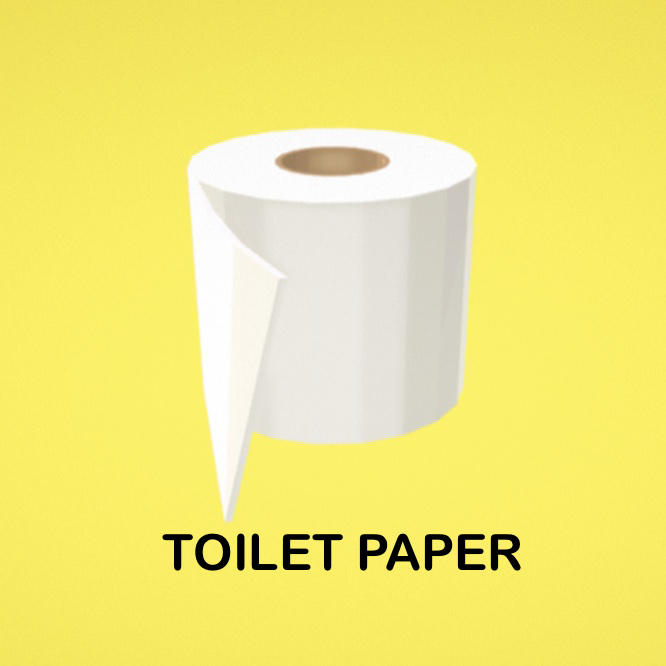
In this AR filter, users are being asked "Which item had a higher increase in sales after COVID-19?" and to choose between a randomly generated pair of items among the total eight entries, including toilet paper, hand sanitizer, bottle water, sunscreen, oat milk, perfume, aerosol disinfectant and thermometer.
After users make the selection by tilting their heads, they switch the camera and check their answers as the AR models launch, visualizing the increase and decrease in sales.
1. Enable front facing/selfie camera and start recording to launch the quiz. (Hold down record)
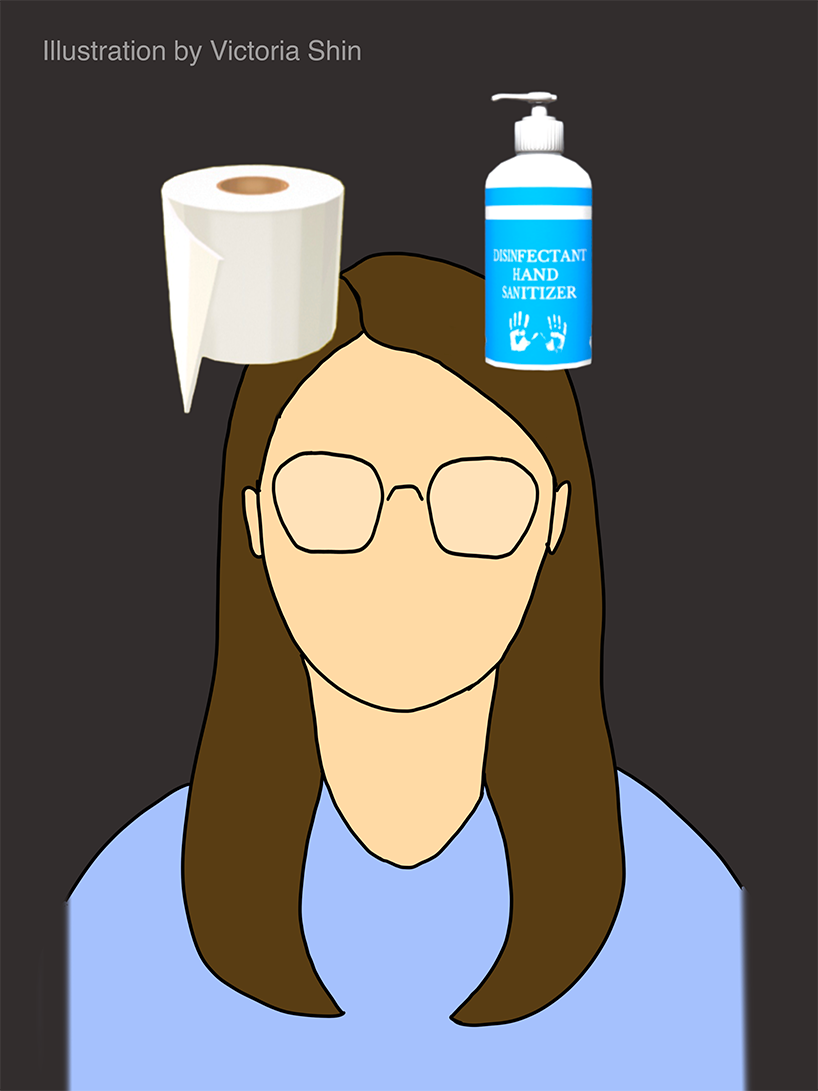
2. Items will start shuffling automatically and randomly select two.
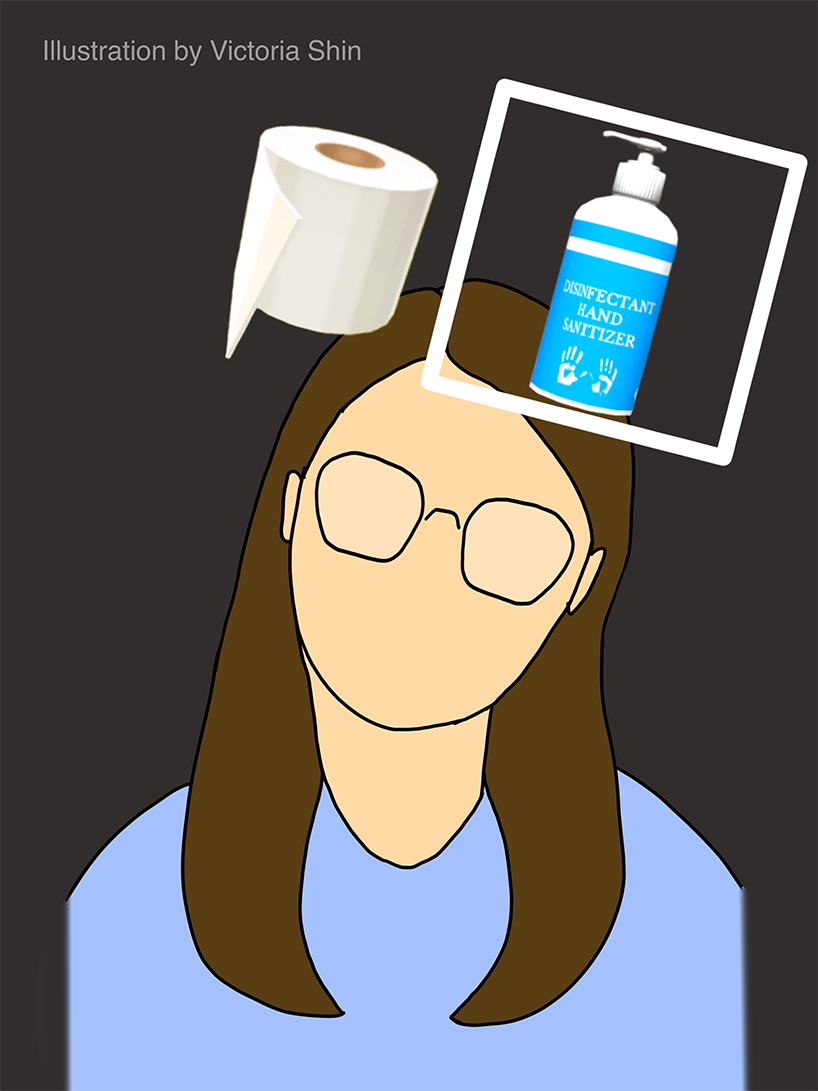
3. Once the randomizer has stopped, tilt your head to select between the two objects.
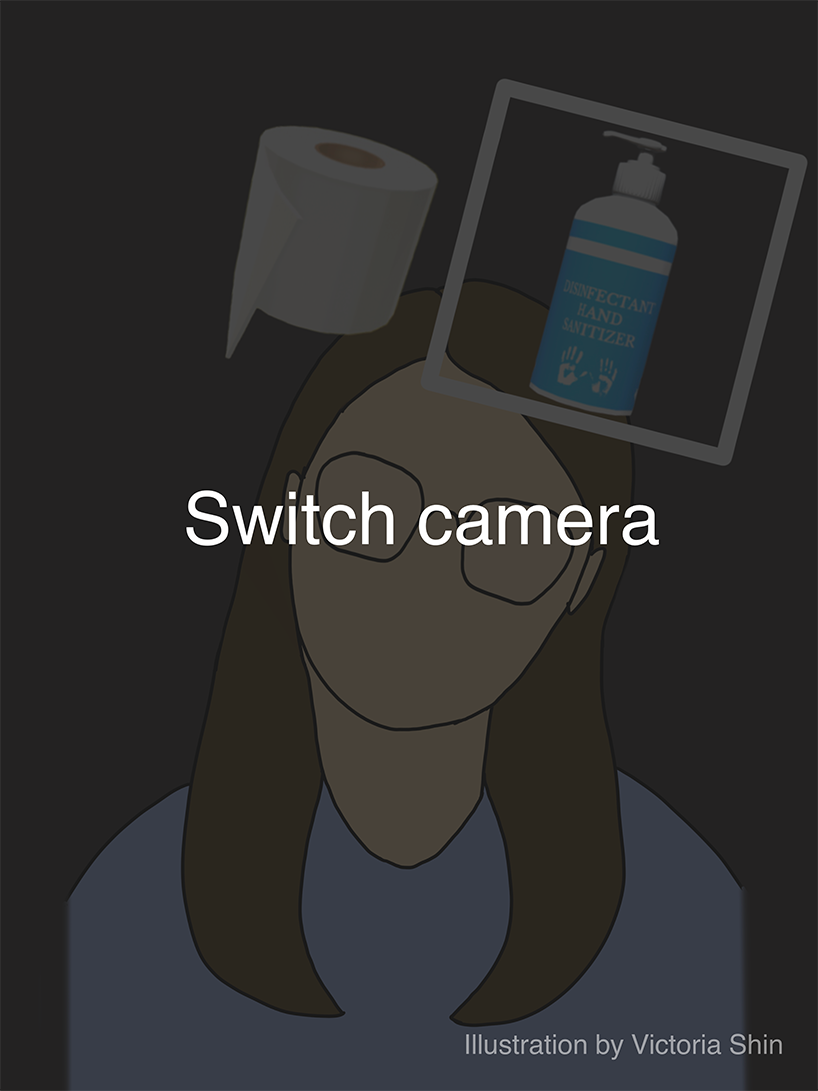
4. Switch to back camera by double tapping on screen or by choosing switch camera icon (keep holding record).
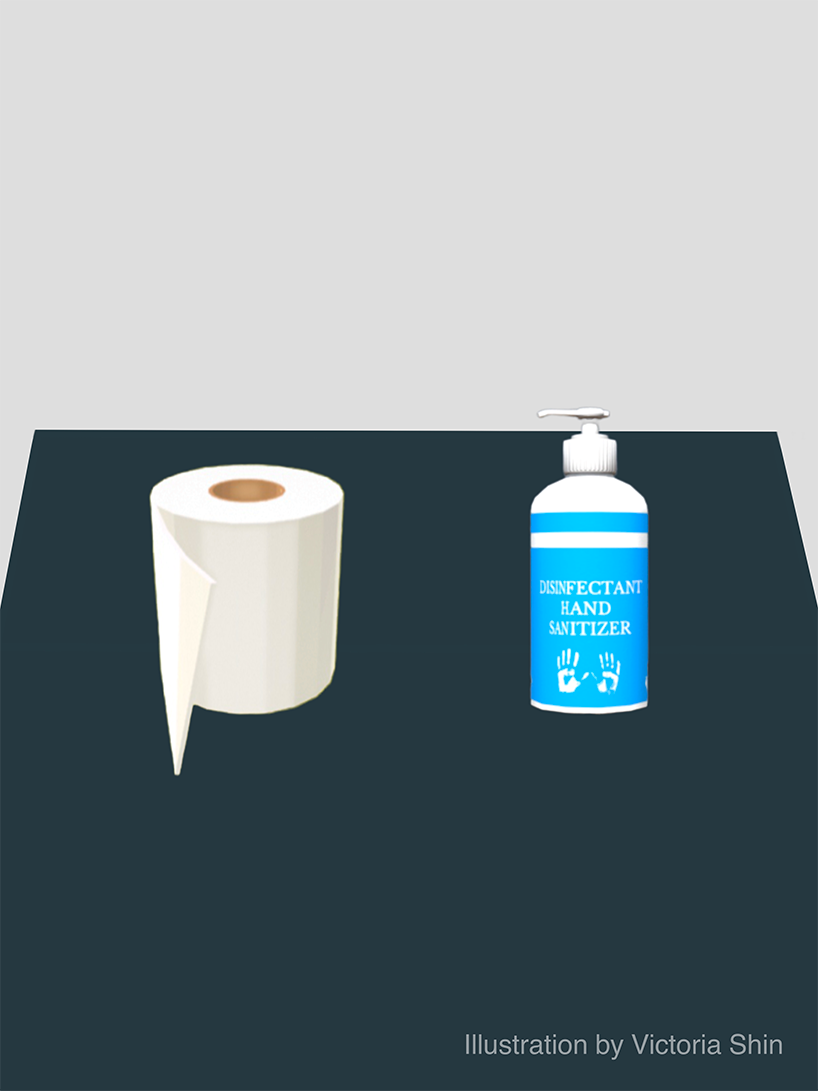
5. Find a flat surface to place the models on.
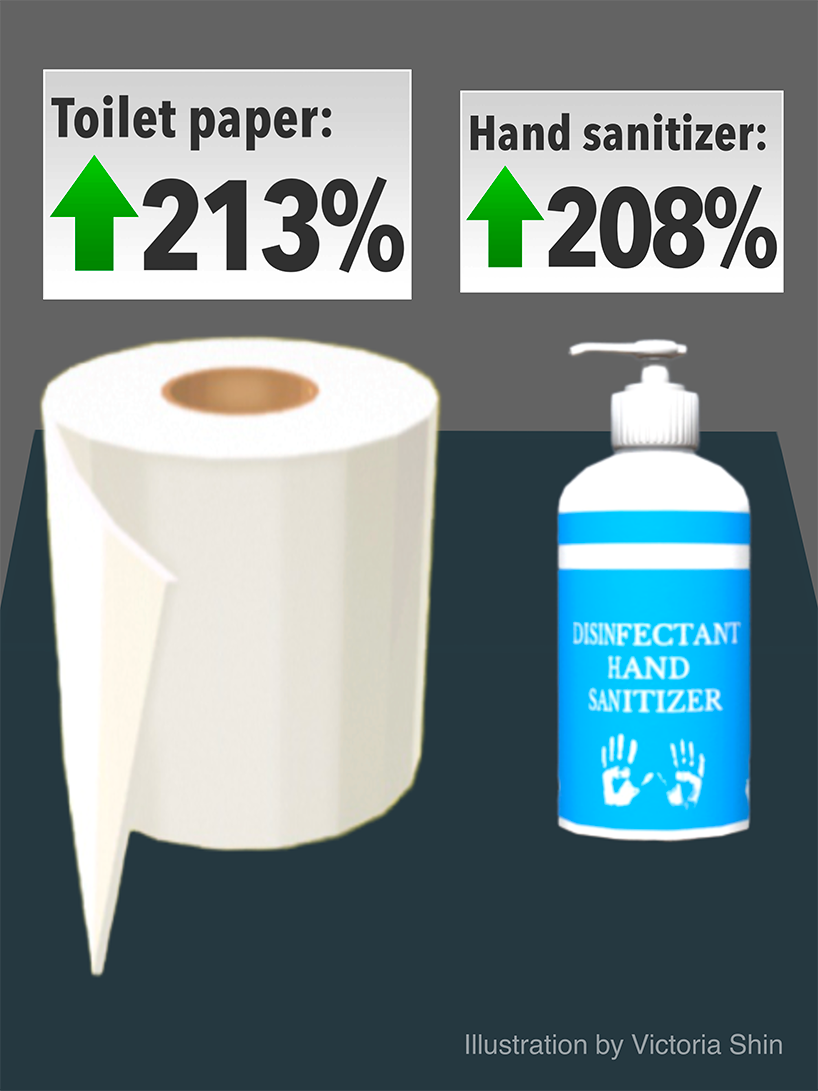
6. See the change in sales for each product, both by percentage and scale.
Jessica Hadiwijoyo, who also worked on the project, said the team first came up with a storyboard of what they envisioned the filter to be like, and collected feedback from the rest of the JOVRNALISM class to build a rough draft. After some usability tests, they adjusted the presentation by addressing users' specific struggles.
"For example, we really wanted to do the visualizing increase and decrease in sales using the scaling up or scaling down the model, because we felt like it was the least distracting as opposed to having small particles of the object fly around in increasing or decreasing amount," Hadiwijoyo said.
The team also decided that flipping the camera to launch the AR models was an essential feature, for it is easier for the user to see the sales difference by comparing it to their direct surroundings.
"It's more intuitive to switch your back camera and sort of pan around your surroundings than to do it on selfie camera and try to move the camera around," Hadiwijoyo said.
Designed in a user-friendly way, the filter is both informative and entertaining, adding to people's existing knowledge of the pandemic. "With all the hoarding going on in the news about toilet paper, hand sanitizers and alcohol, this project is taking this piece of interesting data of what people are buying," Hadiwijoyo said. "I think seeing that [what the inside of grocery stores looked like] in person makes you curious, and this project helps you address that."